

The Portfolio X-Ray is a portfolio-level report highlighting the exposure and diversification measures in a portfolio’s strategy. Use this report to communicate sector and regional exposure, investigate fixed income and equity breakdown in the portfolio and peer into the top underlying holdings of a portfolio of funds. Use this to complement and expand on information presented in performance reports such as the Snapshot Report or Hypothetical Illustration.
Our Portfolio X-Ray breaks down a portfolio in terms of asset allocation, investment style, geographical exposure, stock sectors and top holdings. We offer a Portfolio X-Ray report on both existing and proposed portfolios, examining details including:
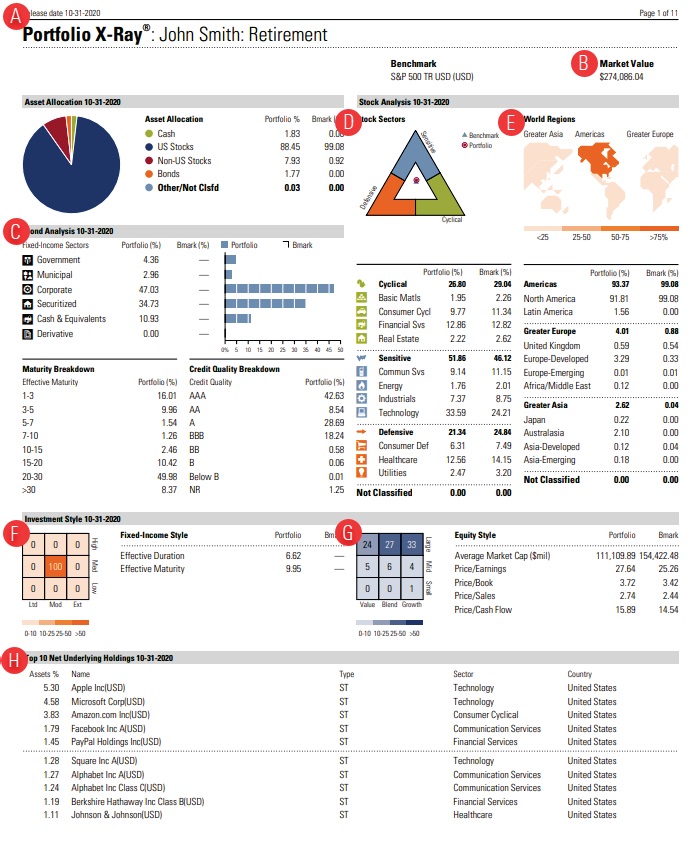
- The Asset Allocation pie chart breaks down portfolio holdings by general asset classes; cash, U.S. stocks, non-U.S. stocks, bonds; and Other/Not classified. Other includes convertible bonds, preferred stocks, and other security types. Not classified represents the portion of the portfolio that, because of missing or unavailable data, cannot be classified.
- Stock Sector analysis is based on Morningstar's proprietary sector classification, which divides the stock universe into three major economic spheres or Super Sectors: Cyclical, Sensitive, and Defensive. Each Super Sector includes several underlying sectors for a total of 11 industry sectors. Percentage weightings are shown for each sector and Super Sector, and the Not Classified figure represents an equity holding that is not assigned a Morningstar classification.
- World Regions shows the allocation of the portfolio's stock positions across three world regions. The darker the country/continent; the higher the percentage exposure to the region. Americas includes North America and Latin America. Greater Asia includes Asia- Developed, Asia-Emerging, Australasia, and Japan. Greater Europe includes the United Kingdom, Europe-Developed, Europe-Emerging, and Africa/Middle East.
- The Fixed-Income Style displays the overall interest rate sensitivity and credit quality of the bonds and bond funds in a portfolio. Placement on the horizontal axis is based on a fund's interest rate sensitivity as measured by the average duration of all the bonds in the portfolio. The vertical axis represents credit quality.
In general, larger percentages in the upper left-hand portions of the Fixed Income Style Box represent a conservative fixed-income exposure for the portfolio, with bonds of investment-grade credit quality and short to intermediate term bond maturity. Conversely, larger percentages in the lower right-hand portions of the Style Box represent a riskier fixed-income allocation for the portfolio, although one that may produce higher yields.
- The Equity Style is a graphical representation of the portfolio's overall investment style, based on the individual securities held both directly and indirectly via the managed products within the portfolio. It is created by classifying the securities within the portfolio according to market capitalization on the vertical axis and growth and value factors on the horizontal axis. Style is first determined at the individual stock level and the individual security attributes are aggregated to determine the overall investment style of the portfolio.
- The Top 10 Net Underlying Holdings section lists the top 10 securities held in the portfolio, either directly or as part of the portfolio of a managed investment product, along with the type of security, its sector, and the country.